Advanced Settings
This page has various settings that are intended for advanced users to
further customize the program:
If this is checked, VoceVista Video Pro will remember which files were open when it was last closed, and open those files again on the next startup.
When VoceVista Video Pro loads compressed files such as Mp3 or Ogg files,
it first converts them into an uncompressed file that will be stored in
your temp folder. This allows much faster access for scrolling and
editing the file, but it might use up a lot of hard drive space. This
setting determines how many uncompressed files will be stored in the temp
folder. If you open a file that has already been uncompressed and is
still in the cache, VoceVista Video Pro will skip the uncompression, which will be much
faster.
When this setting is checked, VoceVista Video Pro will periodically check if a new version is available, which will require an internet
connection.
The Waveform settings control the appearance of the Waveform and the Timeline Views. They are also available by right-clicking on either of those views.
If checked, the Waveform and the Timeline will display intensity on a logarithmic scale.
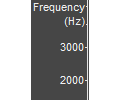
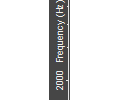
Determines if the text on all scales along the Y-Axis will be vertical or
horizontal. Vertical text uses less screen space, but horizontal text is
easier to read. You can also access this setting by right-clicking on the
actual scale.
 |  |
| Y-Scale with horizontal text | Scale with vertical text |
This settings control the visibility of Markers on different windows. This allows to further refine the Marker visibility in addition to setting the visibility of Markers by type.
If checked, the labels of Markers will be shown on the Timeline. If this option is not checked, only the boundaries of the Markers will be shown.
This is the time range that will be set for new empty documents. By
default it is 10 seconds.
By default, the Timeline range starts with a range of 10 seconds for new recordings and expands as a recording grows longer. If the Timeline range is fixed by setting this option, it will stay the same length at all times.
Sets the number of visible overtone sliders for new empty documents, or
for existing documents that are loaded for the first time.
The Scroll Mode determines what happens when the time cursor reaches the
end of the visible range during recording and playback.
- Scrolling
Keeps the time cursor at fixed
position and scrolls the window to the left.- Paging
Switches to a new empty page and then
moves the time cursor across the page.
This setting allows background lines to be drawn on the Spectrum that mark different intensity levels. By default, these lines are draw 10 decibels apart from each other.
The dynamic range of intensities that is shown on the Spectrum when it is normalized.
This allows to specify an amount of silence that will be added to a file each time recording is stopped.
If this option is checked, the program will automatically start recording into a new empty file after it is started. This can also be achieved by starting the program with the /record command line parameter.
The Signal Generator can be used to play back a test signal over a separate sound card. This feature is specifically intended to measure the resonance of the oral cavity by playing a sound into it, whose echo can then by analyzed.
If this option is checked, the test signal will always be played during recording.
If you have multiple sound cards, you can use a separate output device to play the test signal, while the recorded sound can be played back with the main speakers.
The frequency in Hz of the test signal. Right now the only available signal is a square wave at maximum amplitude.
When moving the mouse across the Analyzer View, helper lines appear to make it easier to read the current cursor position on all scales. These settings allow to individually control the visibility of those lines.
Show the green playback cursor line. Turning this off is mostly useful for taking screenshots where the playback cursor would be in the way.
These settings control the frequency ranges and scale mode of the Vowel Chart.
This setting applies to Windows only, not to Mac. On Windows, the default Audio API to be used is DirectSound. WASAPI is an alternative, more low level API that may offer slightly better performance. It also allows to record the output of playback devices via Loopback Recording. For example, if WASAPI is enabled, you can record “What you hear”, in other words, what is currently being played, if you select your current output device as recording source. The drawback of WASAPI is that, unlike DirectSound, it has no automatic sample rate conversion. For example, if the audio device is set to a sampling rate of 48kHz, you can only record from it with that sampling rate.
This is the approximate time in milliseconds that passes from the moment
a signal arrives in the microphone until it is displayed on the screen. A
lower latency means that the screen is updated more frequently. Therefore
this value should be as low as possible to ensure that the analyzer
display is responsive. However, if the value is too low, your computer
may be unable to process the incoming data quickly enough, and some parts
of the recording my be lost. This will appear as clicks or gaps in the
recording. If you have a fast computer, you can try to lower this value
and see if the recording still appears correct.
This setting is similar to the Recording Latency, but for
playback. A lower number will mean there is less delay between performing an action such as changing the playback position and hearing the result, but if the value is too low you may hear clicks or gaps during
playback. If that is the case, raise the value until playback sounds
smooth and continuous.
The Input Level Meter is the slider on the toolbar that controls input volume and shows the
strength of the current input signal. Here you can change its parameters.
When the Input Level Meter is on, VoceVista Video Pro will always record
sound from your sound card, which could be undesirable in some cases, so
you can turn it off here. You can also right-click on the Input Level
Meter on the toolbar to enable or disable it.
This number determines how often the Input Level Meter is redrawn. You
could lower this value if your computer is very slow, because every
redraw uses up a small amount of CPU time.
