
Colormap Editor
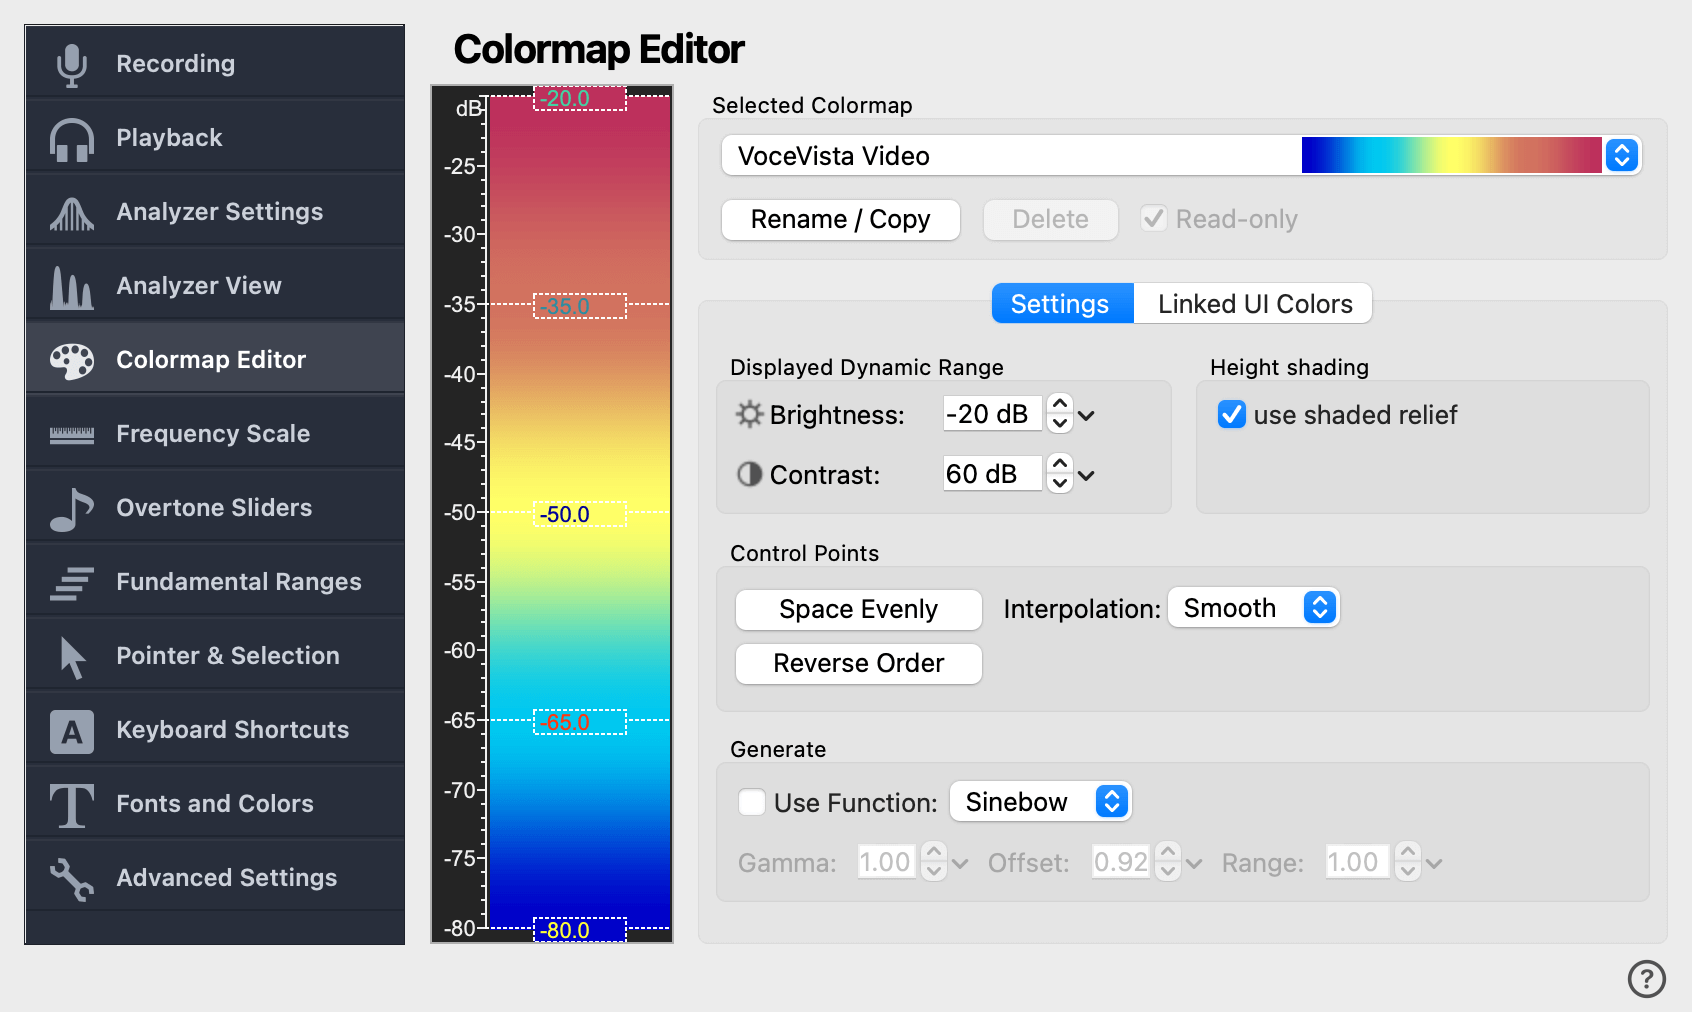
On this settings page you can choose among various colormaps to represent the
intensities on the spectrum and spectrogram. You can also modify existing
colormaps or create your own.
The colored field on the left shows which colors represent a given
intensity level. Colors are interpolated between the existing control
points. You can move and change the control points with the mouse, or
create new control points by double-clicking into empty space:
| Mouse action | Command |
|---|---|
| Click + Drag control point | Move control point |
| Shift + Click + Drag control point | Move control point with more precision |
| Double-click control point | Set color |
| Right-click control point | Bring up context menu to set color or delete point |
| Double-click empty space | Create new control point |
Table 3.5. Colormap Editor Mouse Commands
Note: The lowest control point will always be
set to the background color of the Analyzer View.
This button will arrange all control points such that they all have the
same distance to each other. This can be used after you have changed the
number of control points and want them to be evenly spread.
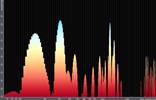
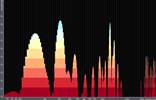
If this is checked, the colors between the control points will be
smoothly interpolated. If the box is not checked, the color scheme will
use hard color boundaries between the different control points (also look
at the different but related setting Smooth Spectrogram
Colors).
Here is an example of a spectrum with and without colormap interpolation:
This is the range of intensities represented by the colormap. The
intensities are measured in decibels (dB). A value of 0dB corresponds to
the loudest possible sine wave that can be represented by the selected
audio format. With a recording bit depth of 16 bits per sample, it is
theoretically possible to represent a dynamic range of 96dB. However, on
the spectrogram it is often better to limit the shown dynamic range to
reduce the amount of displayed noise. The dynamic range sliders can also
be found on the toolbar and are useful for adjusting the displayed
dynamic range on the fly to get the best contrast on the
spectrogram.
The best way to understand those sliders is to play with both of them.
This slider adjusts the top level (or saturation value) of the displayed
dynamic range. In the displayed spectrogram or spectrum, all values with
an intensity above the value of this slider will be displayed as maximum
intensity.
This determines the width or spread of the displayed dynamic range. A
large value will show more detail at the expense of clarity, and a small
value will make the stronger intensity values stand out more.
This tab will bring up a window similar to the Fonts and Colors editor. However, all changes
made here are local to the current colormap. For example, the background
color of the spektrum is normally determined by the global color scheme.
With the ‘Linked UI Colors’ feature, you can change the background
locally, for example to white. Similarly, you can adjust other UI element
colors to match your preferred colormap.