Spectrogram & Spectrum
So far we’ve only looked at the pitch line, which shows the fundamental pitch of the
recording. Now let’s look at the Spectrogram, which shows how loud the recording is at
each point of the frequency range. Click on the Settings
button on the toolbar ![]() , and then select Analyzer
, and then select Analyzer
View on the left, and Acoustic on the top, to
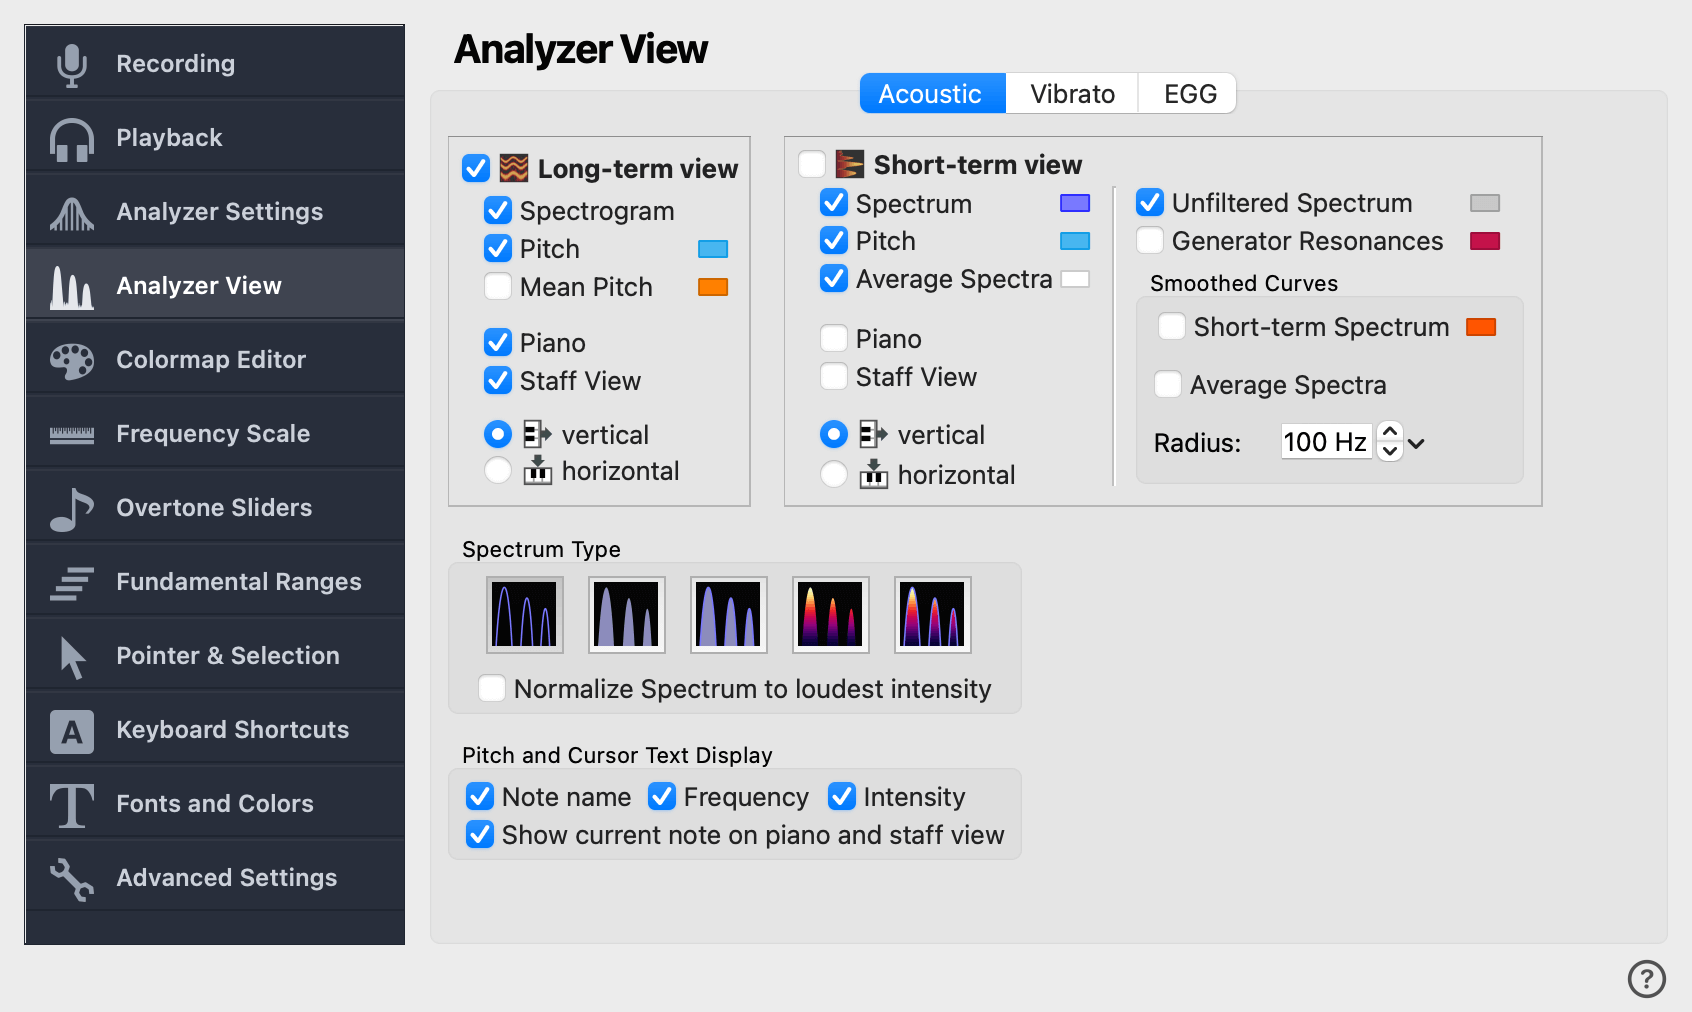
open the Analyzer View settings page:
Check the option on the left column, just under
. Then close the settings window.
Now you should already see the Spectrogram, but the screen might still be zoomed in very
far from the previous step. On the toolbar, click on
and select the Standard Frequency Range profile. Then click
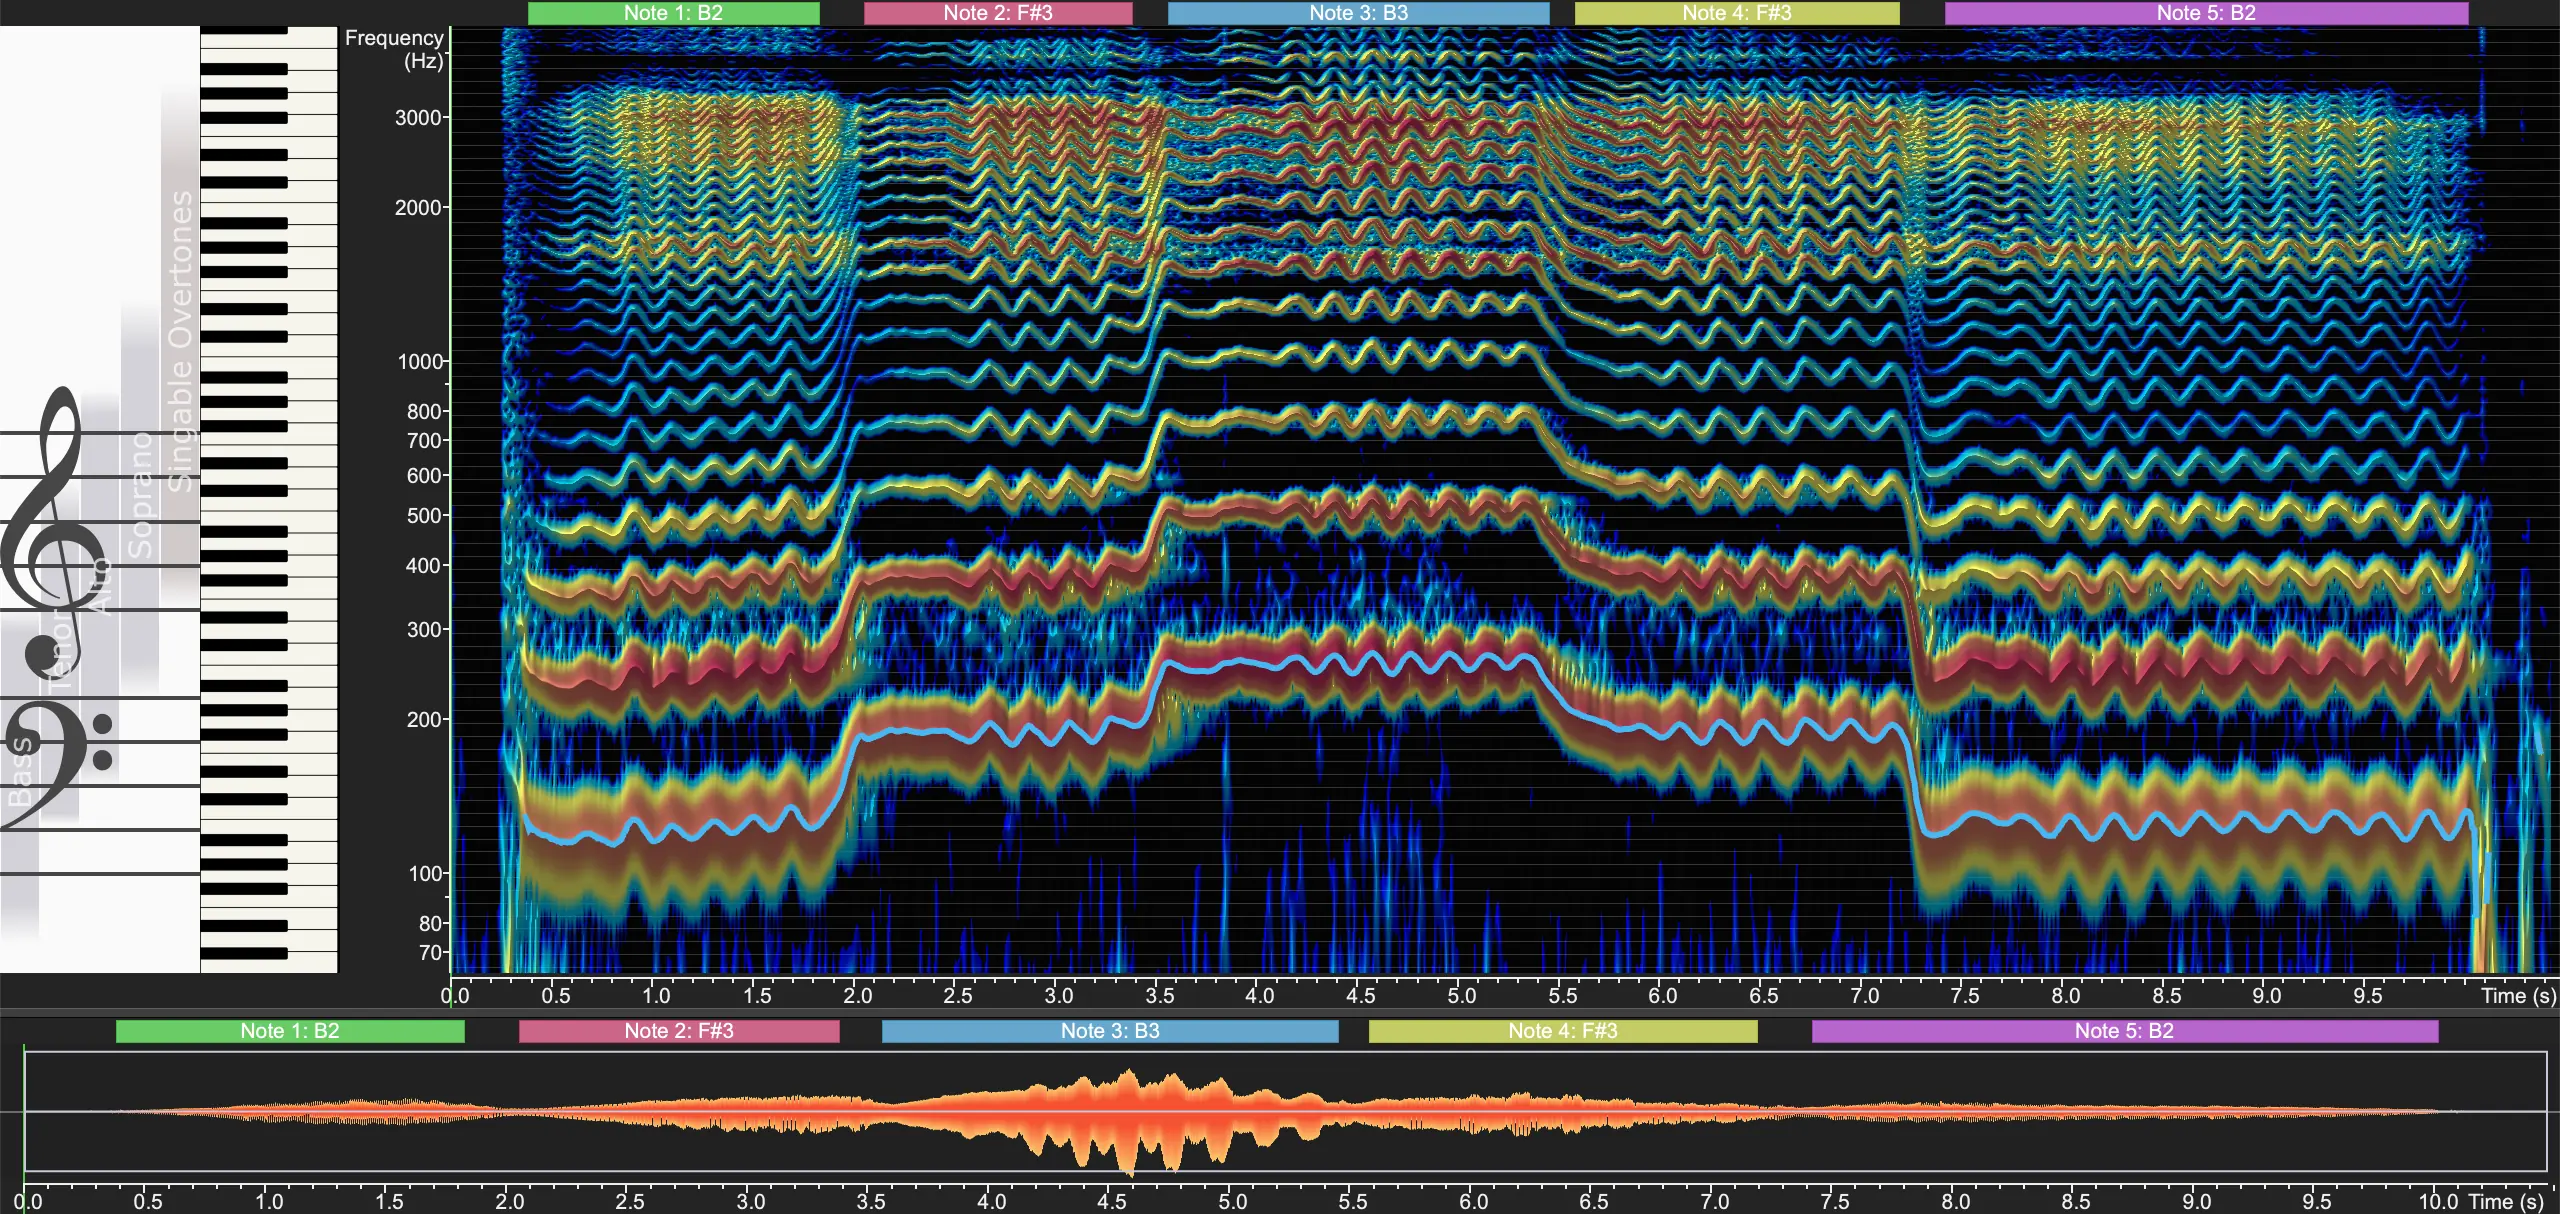
on → . Now your screen should look similar to this:
The colors on the spectrogram indicate the intensity of the sound for each frequency. In
other words, the spectrogram shows which frequencies are in the sound, and how loud they are.
To see this in more detail at any given point in time, we can enable the Short-term view, and in particular, the Spectrum. Reopen the Analyzer View settings
page and check the and
options.
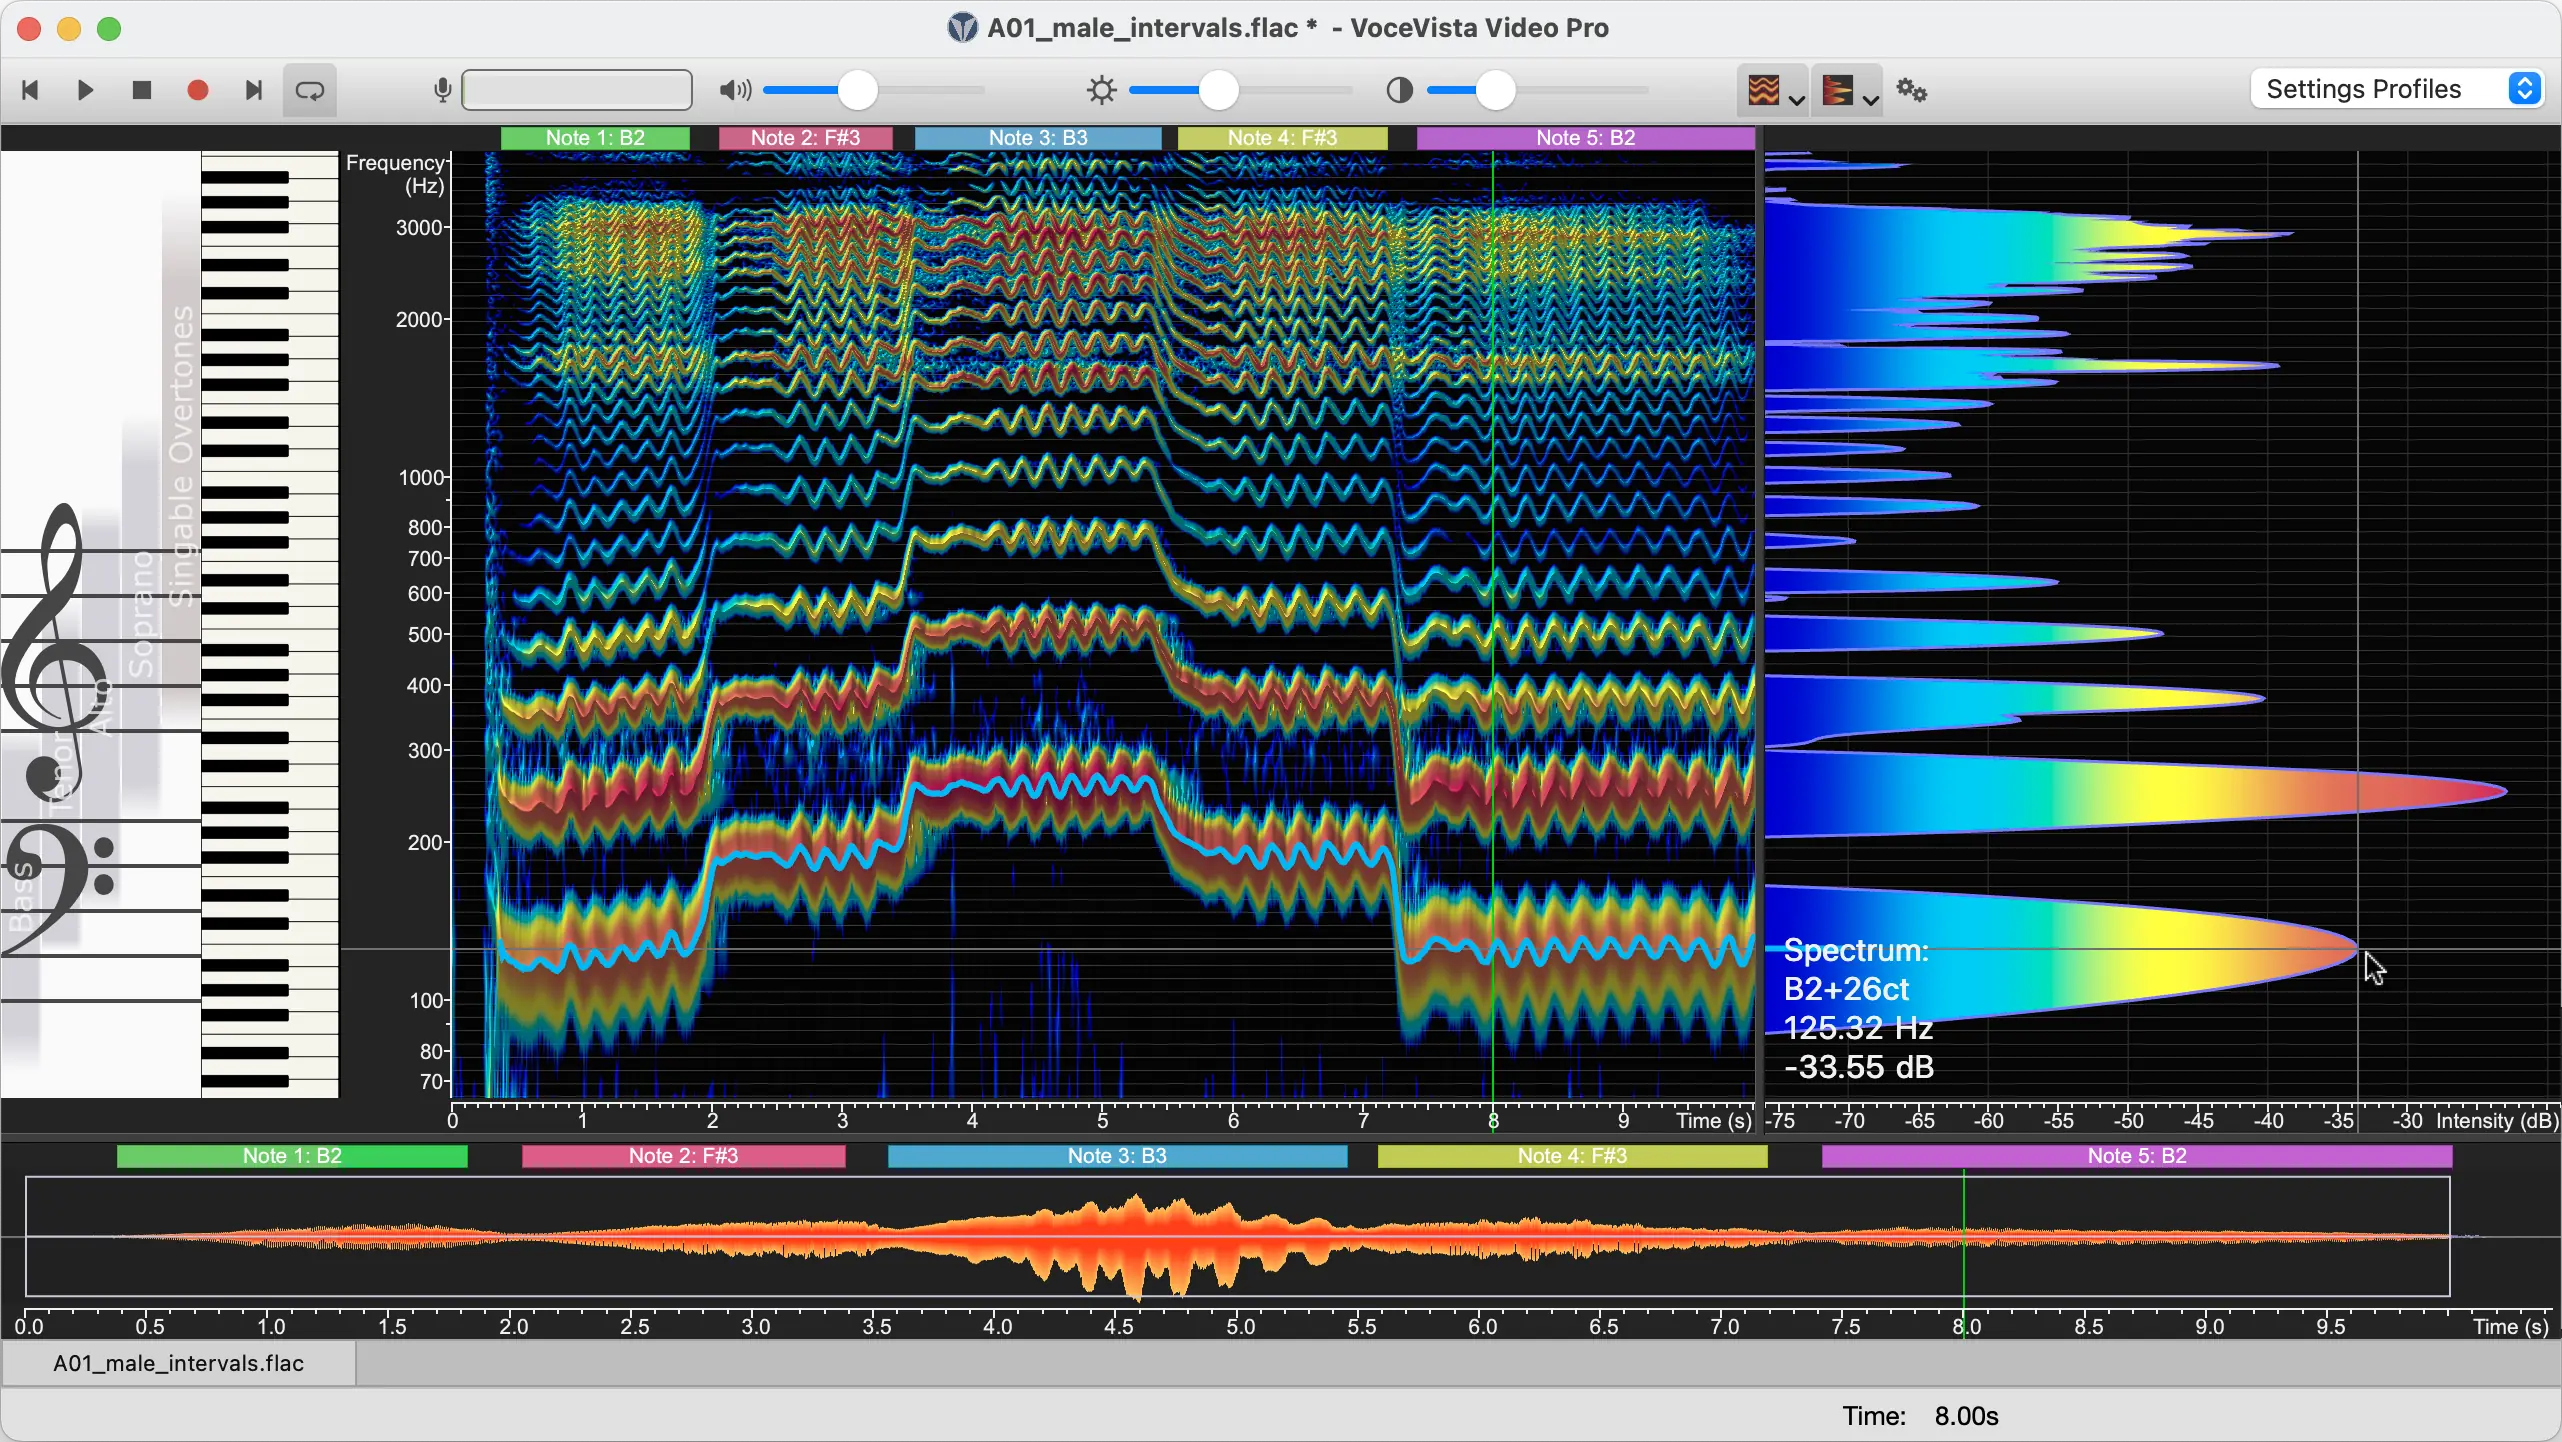
Now the screen is split into two parts. The left side contains the Long-term view, which hows how the recording changes over time. The right side
contains the Short-term view, which shows details of the
recording at the specific point in time where the green time cursor line is located. Move the
pointer around over the spectrum with the mouse button held down, and observe how the spectrum
changes as you move the cursor to different time positions. Now move the green cursor line to
8.0 seconds.
Move the brightness slider on the toolbar (as shown on Figure 2.3) and see how the dynamic range of the spectrum and spectrogram
changes in response to that. Adjust the brightness slider so that all peaks on the spectrum
are fully visible. Then point at some of the spectral peaks on the right side and see how the
text display on the Short-term view shows the current frequency, nearest musical note, and
intensity, for each peak in the spectrum:
So now you can see the that the sound in our recording contains many individual frequency
components that have different levels of intensity. These are the harmonics. To better
understand what this means, let’s use another feature of VoceVista Video Pro: the Frequency
Filter.


