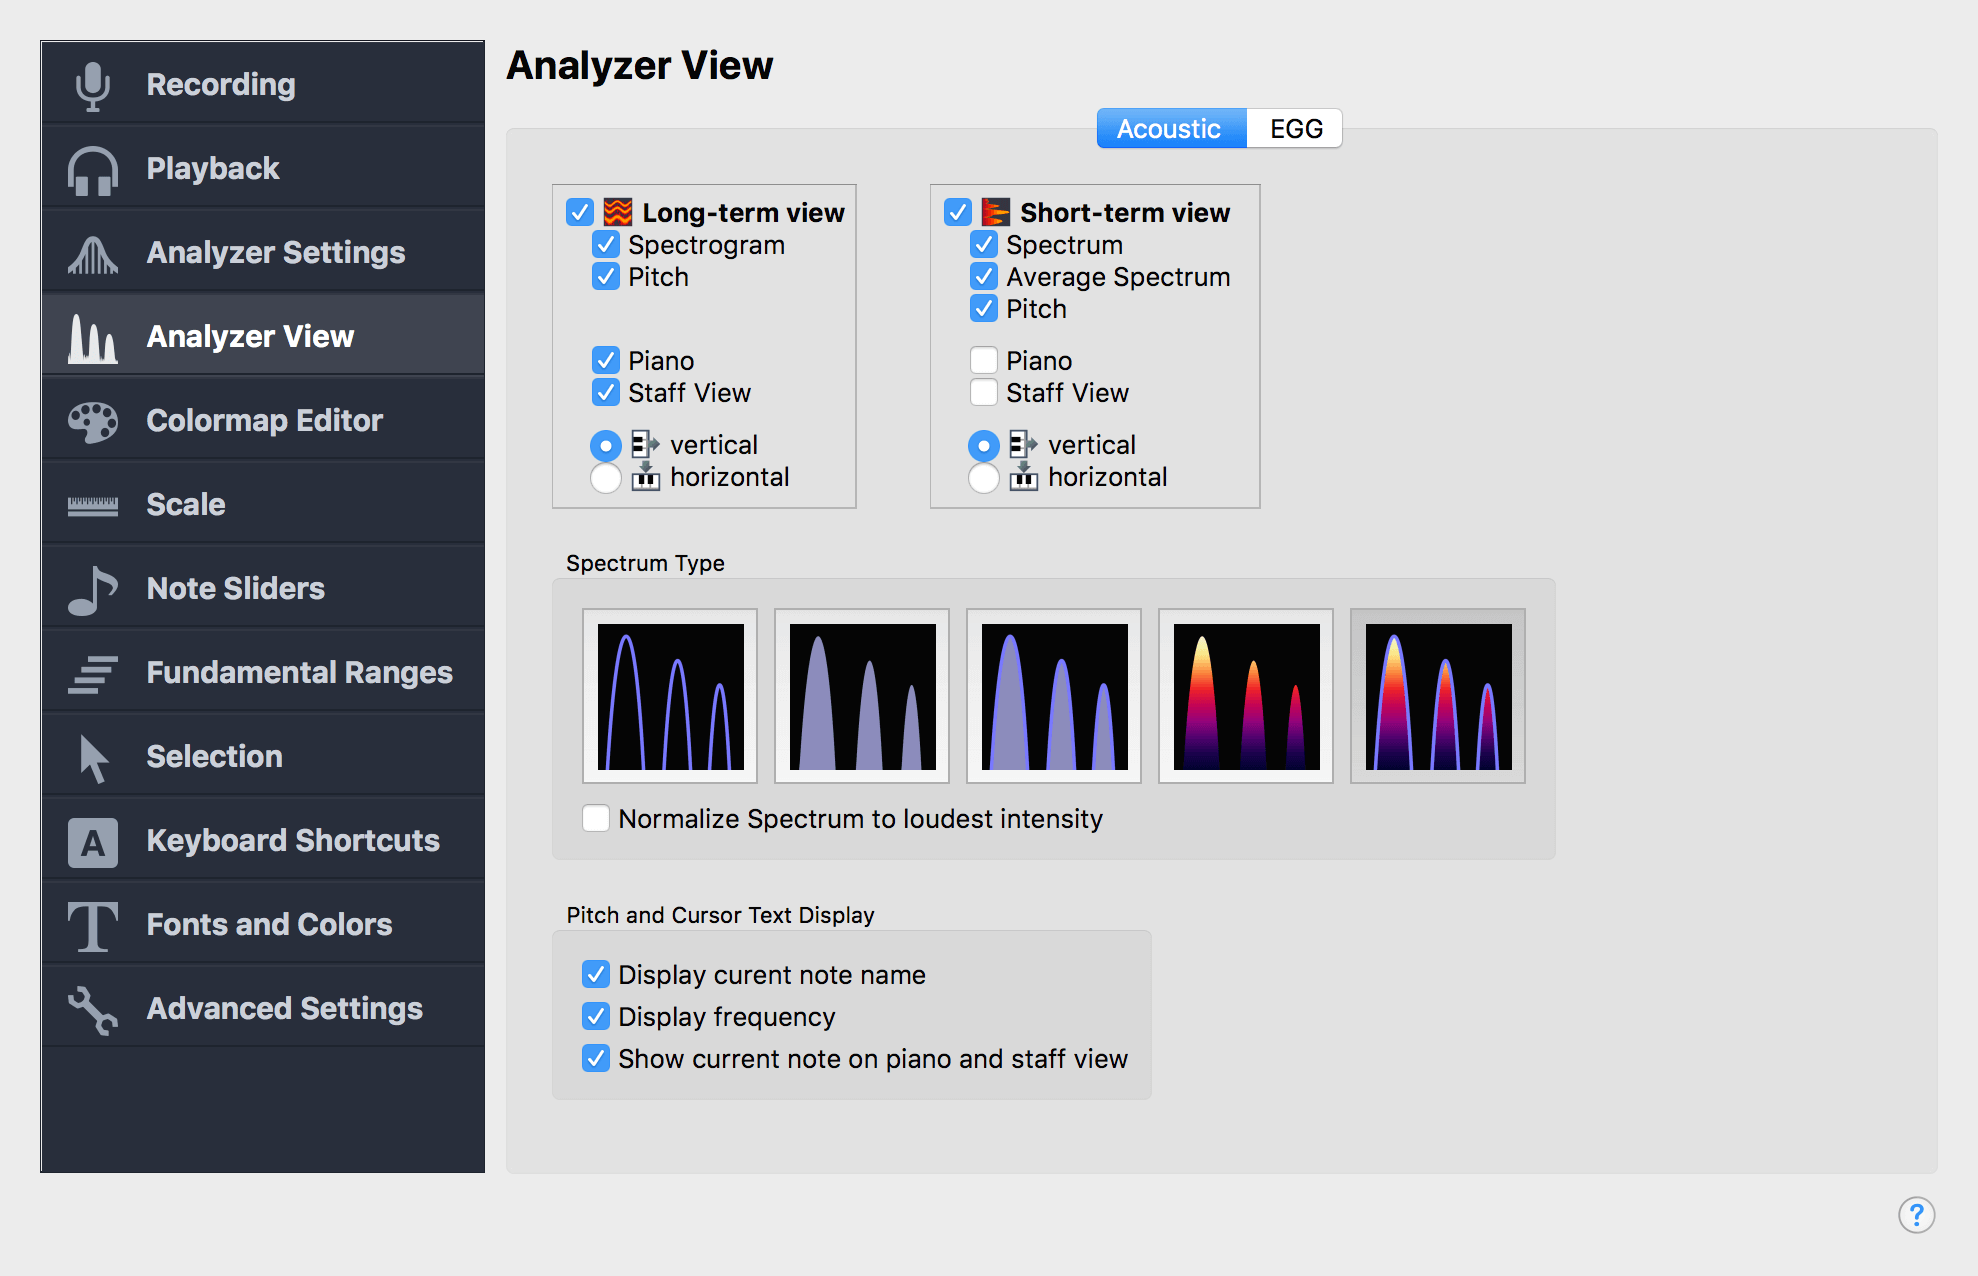
Acoustic Analyzer View
On this settings page you can choose the appearance and behaviour of the
Analyzer View.
This selects the kind of analysis that you want to show. The main analyzer window can show a single view, or it can be split into a long-term view (for the spectrogram) and short-term view (for the spectrum). If both views are active, the cursor position in the long-term view determines the content of the short-term view.
The spectrum shows a
graph of intensity per frequency. The spectrogram shows how the spectrum
changes over time. Pitch shows the fundamental frequency. Showing neither spectrogram nor pitch can useful if you want
to work with the Overtone Sliders alone.
Here you can select various options for the appearance of the spectrum.
These options allow you to customize the appearance of the pitch display. The current note always corresponds to the fundamental pitch at the current cursor position.
- Display current note name
If the short-term view is active, the name of the current note is displayed on top of the spectrum.
- Display frequency
If the short-term view is active, the frequency of the current pitch will be shown in Hz on top of the spectrum.
- Show current note on piano and staff view
If this is checked, the current note is highlighted on the piano, and shown as musical note on the staff view.

