
Analyzer View
This is the main view of VoceVista Video Pro. The Analyzer View can show the spectrum, the spectrogram, the fundamental pitch, or any combination of these. You can select what to display on the toolbar or on the Analyzer View settings page.
This view can also display overtone sliders and other overlays. Surrounding the Analyzer View are the Frequency Scale, Time Scale, and Intensity Scale. They can be turned on and off in the
Menu.
The Spectrogram Display is very similar to the spectrum, but instead of a single spectrum,
it shows a series of spectra over time:
The bottom scale now shows time instead of intensity, and the intensity is now represented
by the color of each point on the display. Think of it as looking at a series of stacked
spectra from the top.
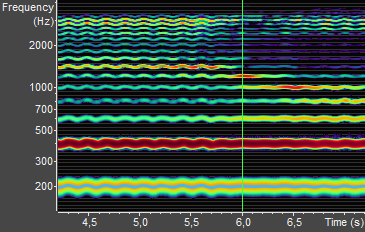
In Figure 3.7, you see the spectrogram
of a male singer. The fundamental pitch moves around 200 Hz. The periodic rise and fall of the
pitch is the vibrato of the singer. The second harmonic at 400 Hz is much louder than the
first. The higher harmonics between 600 Hz and 2000 Hz change over the time range shown. This
is because the singer is changing the vowel he is singing. The singer’s formant at 3000
Hz stays strong throughout.
The Spectrum Display shows the intensity of the frequency components of a sound at a
specific point in time. It can also show the fundamental pitch of the sound at this
time:
The frequency axis is shown in Hertz (cycles per second, abbreviated Hz), and the
intensity axis is shown in decibel (dB). The loudest possible tone has 0 dB, and all tones
quieter than that have a negative decibel value.
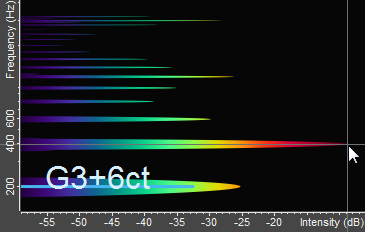
In Figure 3.8, the first spectral peak is
at about 200 Hz and has an intensity of -25 dB. The second peak is louder. It has a frequency
of about 400 Hz and an intensity of -9 dB. The cursor cross hair is snapped to the second peak
at 400 Hz. The pitch display (the straight blue line) shows a fundamental pitch of about 200
Hz, which corresponds to the note “G3+6ct”.
The range of the intensity scale can be adjusted with the dynamic range slider on the
toolbar. The range of the frequency scale can be adjusted on the Scale settings page, or on the Scale Range
toolbar.
All scales can also be zoomed and scrolled with the mouse. To scroll the scale range, left
click and drag a scale. To zoom it, point at the scale and use the mouse wheel. If you
don’t have a mouse wheel, you can also point the cursor at the scale and use the the
and keys to zoom.
You can select different color schemes and display types for the spectrum display in the
program options, in particular on the Analyzer
View settings page and the Colormap
Editor.
It is possible to show spectrogram and spectrum side by side:
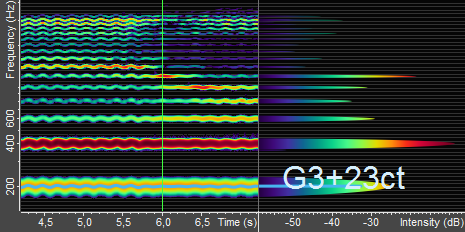
In this case the spectrogram on the left side shows how the frequency components change over time, and the spectrum on the right shows more details for a specific point in time. If you move the mouse cursor over the spectrogram, the right side will show the spectrum for the time pointed at by the mouse. If the mouse cursor is not over the spectrogram, the spectrum will show the frequency components for the time where the green cursor line is.
For example, in the image above, the cursor is at 6.0 seconds, so the spectrum shows a cross-section of the spectrogram at this time.
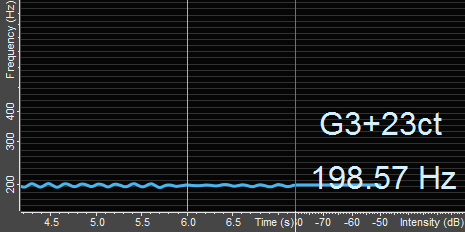
It is possible to turn off spectrogram and spectrum and show only the fundamental pitch,
as in Figure 3.10.