Frequency Filter
Frequency Filters are only available in VoceVista Video and VoceVista Video Pro.
Frequency Filters are a tool that allows to pick out specific frequency ranges and listen
to them in isolation, or to change their intensity to make them louder or softer. This helps
to understand the spectral composition of the recorded sound.
Continuing with the same sample file (“A01_male_intervals.flac”), select the time range
that encompasses the voiced part of the last sung note (hence select the range from 7.5 s to
9.5 s), and center the view on this range. Adjust the visible frequency range so that the
fundamental pitch of the note is at the bottom of the screen, and the part around 3000 Hz can
be clearly seen (hence set the frequency range to something like 80 Hz – 4000 Hz).
Now click on → . Your screen should now look like this:
The grey frame at 100 Hertz is the Frequency Filter. It will remove all frequencies
outside of its range. Check that the loop icon on the toolbar
is pressed, and then start playback again and hear the effect of the filter. Then, while
playback is running, move the filter up and down by dragging its grey frame with the mouse.
You can change the width of the filter by dragging the red handles that appear when the mouse
cursor hovers over the filter.
The spectrum on the right now shows a white outline of the original spectrum. The part in
color is all that is left by the Frequency Filter. With this, you can listen to the individual
harmonics or overtones in your sound.
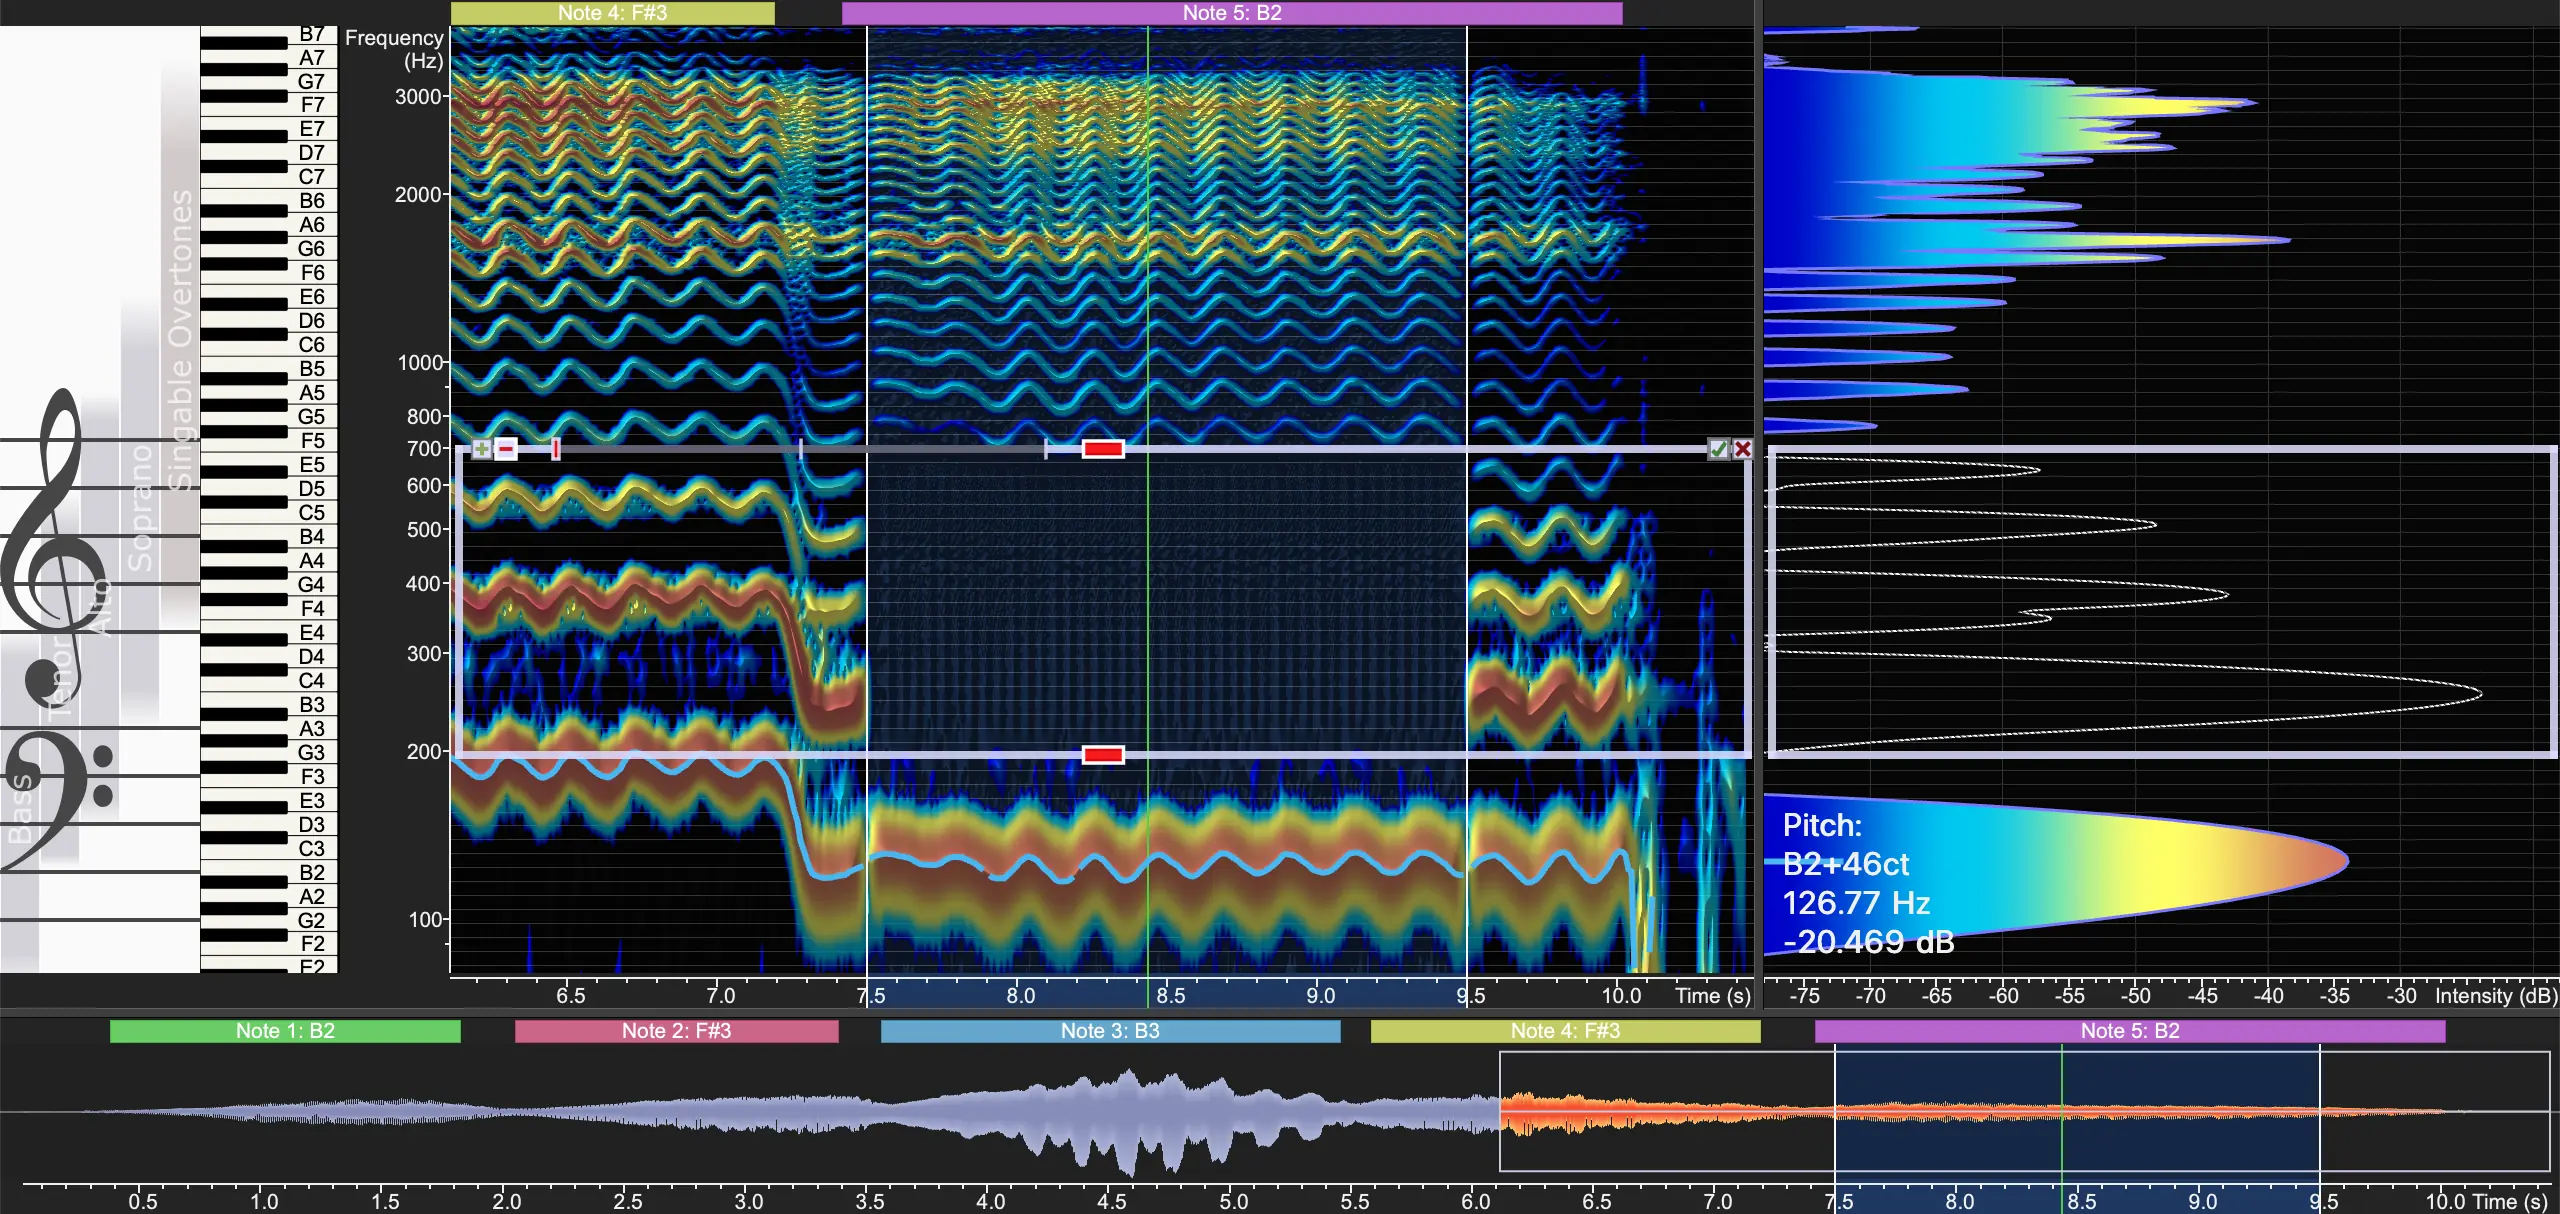
Now click on → to invert the filter. Instead of keeping only the frequencies inside of it, it
now punches a hole in the spectrum by filtering out the frequencies in its range. To see this
more clearly, set the brightness slider on the toolbar to -18 dB, and set the contrast slider
to 60 dB. Drag the Frequency Filter to cover the range from 200 to 700 Hz, so that it removes
the second, third, fourth and fifth harmonics in the recording:
Notice in Figure 2.19 how the
Spectrum shows an outline of the second to fifth harmonics, while the other harmonics are in
color. Once again, start playback, and move the filter up and down to hear its effect.
To remove the filter, click on the button on its top right
corner.


